> ## Documentation Index
> Fetch the complete documentation index at: https://docs.dataerai.com/llms.txt
> Use this file to discover all available pages before exploring further.
# Datasets & versions
> Turn uploaded data into a versioned, analysis-ready dataset, and follow each version through preprocessing to Ready.
A **dataset** is a curated, versioned view of your data, prepared so it can be analyzed and visualized. Where an [asset](/organize/assets) holds your files, a dataset adds **versioning** and **preprocessing**: Dataerai analyzes each version to understand its structure so it's ready to explore.
## Datasets and versions
A dataset is the *logical* identity of your data. Each time you provide new content, Dataerai adds a new **version** under the same dataset rather than creating a separate one — so `v1`, `v2`, and so on form a history. Each version is an **immutable snapshot**: once created, its data doesn't change.
## The version lifecycle
When a version is created, Dataerai preprocesses it. You can watch its **status** as it moves through the pipeline:
| Status | Meaning |
| ------------------------- | ----------------------------------------------------------------------- |
| **Uploaded** | The version exists; preprocessing hasn't started. |
| **Preprocessing queued** | Waiting for a preprocessing run. |
| **Preprocessing running** | Dataerai is analyzing the data. |
| **Ready** | Preprocessing succeeded; the version is ready to explore and visualize. |
| **Preprocessing failed** | Something went wrong; see the error and retry. |
| **Deprecated** | Superseded or retired. |
A failed version can be retried, which puts it back in the queue. Older versions can be deprecated when they're no longer current.
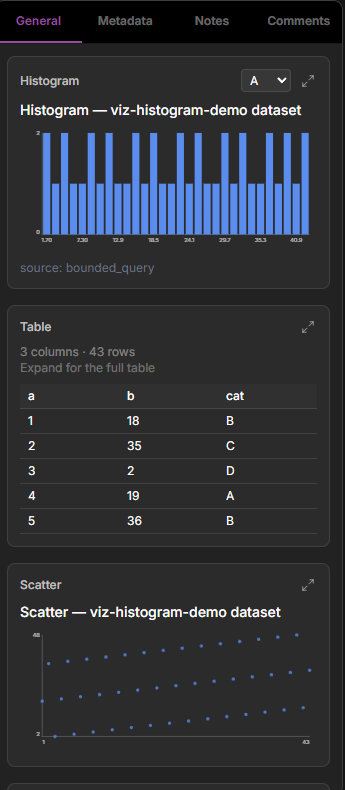
For tabular data, Dataerai can prepare a dataset for you automatically. When you select a tabular asset (such as a CSV), it promotes and preprocesses the data in the background and shows a chart as soon as the version is **Ready**.
## What you get when a version is Ready
Once a version reaches **Ready**, Dataerai has analyzed it so you can:
* See its inferred structure — [understand your data](/datasets/understand-your-data).
* Explore it with built-in charts — [visualize your data](/datasets/visualize).
 ## Next steps
Schema inference and summary statistics for tabular data.
Histograms and category charts, right in Dataerai.
## Next steps
Schema inference and summary statistics for tabular data.
Histograms and category charts, right in Dataerai.