> ## Documentation Index
> Fetch the complete documentation index at: https://docs.dataerai.com/llms.txt
> Use this file to discover all available pages before exploring further.
# Understand your data
> When a tabular dataset version is ready, Dataerai has inferred its schema and computed summary statistics for every column.
When a tabular [dataset version](/datasets/overview) reaches **Ready**, Dataerai has analyzed it so you don't have to open the file to know what's inside. Two things are produced automatically: a **schema** and **summary statistics**.
## Inferred schema
Dataerai infers each column's name and **type** — for example:
* **Quantitative** — numeric measurements.
* **Nominal** — categories and labels.
* **Temporal** — dates and times.
* **Boolean** and **string** values.
The schema is what lets Dataerai pick the right chart for a column and helps you reason about a dataset before you dig in.
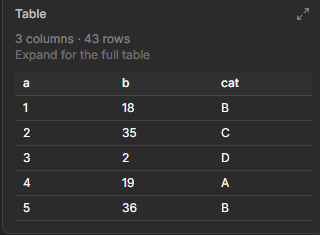 ## Summary statistics
For each column, Dataerai computes a profile so you can spot issues and understand distributions at a glance, including:
* Counts and how many values are missing.
* The number of distinct values.
* Ranges and quantiles for numeric columns.
* The most common values (category counts) for categorical columns.
## Summary statistics
For each column, Dataerai computes a profile so you can spot issues and understand distributions at a glance, including:
* Counts and how many values are missing.
* The number of distinct values.
* Ranges and quantiles for numeric columns.
* The most common values (category counts) for categorical columns.
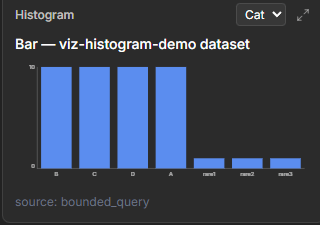 ## Why it matters
The schema and statistics power the rest of the analysis experience: they drive the [built-in charts](/datasets/visualize) and help you catch problems — an unexpected type, a column full of nulls, a surprising range — early.
## Next steps
Turn these columns into histograms and category charts.
## Why it matters
The schema and statistics power the rest of the analysis experience: they drive the [built-in charts](/datasets/visualize) and help you catch problems — an unexpected type, a column full of nulls, a surprising range — early.
## Next steps
Turn these columns into histograms and category charts.