> ## Documentation Index
> Fetch the complete documentation index at: https://docs.dataerai.com/llms.txt
> Use this file to discover all available pages before exploring further.
# Provenance & relationships
> Capture how your data came to be by linking assets with typed relationships and recording how analyses were performed.
Research data has history: a sample is prepared, measured, and analyzed; one result is derived from another. Dataerai captures that history as **relationships** between assets, so the lineage of your data stays with the data.
## How relationships work
A relationship is a directed link from one asset to another, with a **type** that describes the connection. Types are free-form so they can match your domain — common examples include:
* `analysis_of` — this asset is an analysis of another
* `prepared_from` — this sample was prepared from another
* `created_sample` — this measurement created or used a sample
Linking assets builds a lineage you can follow — for example, **sample → measurement → analysis** — and makes related data easy to find from any point in the chain.
 ## View and add relationships in the app
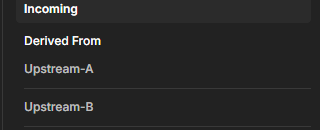
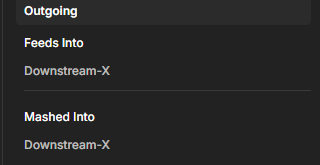
Open an asset and look at the **Relationships** section in the **General** tab of its detail panel. Relationships are grouped by direction — **Incoming** (what this asset was derived from) and **Outgoing** (what it feeds into) — and then by type within each direction.
Use the view toggle in the section header to switch between two layouts:
* **List view** shows each direction and type as a flat, scannable list of related assets.
* **Tree view** shows the same relationships as an expandable tree you can collapse and open by direction and type.
To add a relationship, click the **+** button in the section header and fill in the inline form:
* **Target asset ID (UUID)** — the asset you're linking to. Paste its UUID (this is a direct ID entry, not a name search).
* **Type** — a free-form verb describing the connection, for example `analysis_of`.
* An optional **analysis mode** from the dropdown (see below).
Click **Add** to create the link. The link is directed from the current asset to the target asset. You can remove an outgoing relationship with the **×** next to it — only the asset that owns the link (the source) can delete it.
## Record how an analysis was done
A relationship can also note the **analysis mode** — how the analysis affected the sample. The dropdown options are non-destructive, altering, destructive, in-situ, ex-situ, invasive, and non-invasive, plus a blank "no analysis mode" choice. Capturing this is valuable for reproducibility and for understanding whether a sample survived a measurement.
When you create a relationship through the [SDK](/sdks/python) or REST API, you can also attach a free-text **note**, a **timestamp**, and arbitrary **qualifiers** to record when and how the connection was made. The web form captures the target, type, and analysis mode; the note, time, and qualifier fields are available programmatically.
## Create relationships from code
Use the Python SDK when your notebook or analysis pipeline creates a new asset and should link it back to its source data:
```python theme={null}
relationship = client.create_relationship(
derived_asset_id,
raw_asset_id,
relationship_type="derived_from",
analysis_mode="non_destructive",
qualifiers={"tool": "pycroscopy"},
)
```
The link is directed from the derived asset to the source asset. See the [pycroscopy guide](/sdks/pycroscopy) for a complete notebook-style preservation example.
## Why it matters
Provenance makes your data trustworthy and reproducible: anyone who finds a result can trace it back to the raw data and the steps in between. It also complements [attribution](/attribution/grants), which links data to the grants and publications behind it.
## Next steps
The asset these relationships connect.
Link data to grants, publications, and contributors.
## View and add relationships in the app
Open an asset and look at the **Relationships** section in the **General** tab of its detail panel. Relationships are grouped by direction — **Incoming** (what this asset was derived from) and **Outgoing** (what it feeds into) — and then by type within each direction.
Use the view toggle in the section header to switch between two layouts:
* **List view** shows each direction and type as a flat, scannable list of related assets.
* **Tree view** shows the same relationships as an expandable tree you can collapse and open by direction and type.
To add a relationship, click the **+** button in the section header and fill in the inline form:
* **Target asset ID (UUID)** — the asset you're linking to. Paste its UUID (this is a direct ID entry, not a name search).
* **Type** — a free-form verb describing the connection, for example `analysis_of`.
* An optional **analysis mode** from the dropdown (see below).
Click **Add** to create the link. The link is directed from the current asset to the target asset. You can remove an outgoing relationship with the **×** next to it — only the asset that owns the link (the source) can delete it.
## Record how an analysis was done
A relationship can also note the **analysis mode** — how the analysis affected the sample. The dropdown options are non-destructive, altering, destructive, in-situ, ex-situ, invasive, and non-invasive, plus a blank "no analysis mode" choice. Capturing this is valuable for reproducibility and for understanding whether a sample survived a measurement.
When you create a relationship through the [SDK](/sdks/python) or REST API, you can also attach a free-text **note**, a **timestamp**, and arbitrary **qualifiers** to record when and how the connection was made. The web form captures the target, type, and analysis mode; the note, time, and qualifier fields are available programmatically.
## Create relationships from code
Use the Python SDK when your notebook or analysis pipeline creates a new asset and should link it back to its source data:
```python theme={null}
relationship = client.create_relationship(
derived_asset_id,
raw_asset_id,
relationship_type="derived_from",
analysis_mode="non_destructive",
qualifiers={"tool": "pycroscopy"},
)
```
The link is directed from the derived asset to the source asset. See the [pycroscopy guide](/sdks/pycroscopy) for a complete notebook-style preservation example.
## Why it matters
Provenance makes your data trustworthy and reproducible: anyone who finds a result can trace it back to the raw data and the steps in between. It also complements [attribution](/attribution/grants), which links data to the grants and publications behind it.
## Next steps
The asset these relationships connect.
Link data to grants, publications, and contributors.